
Key Insights: State Pandemic Unemployment Insurance Programs
Historic unemployment.
Record relief.
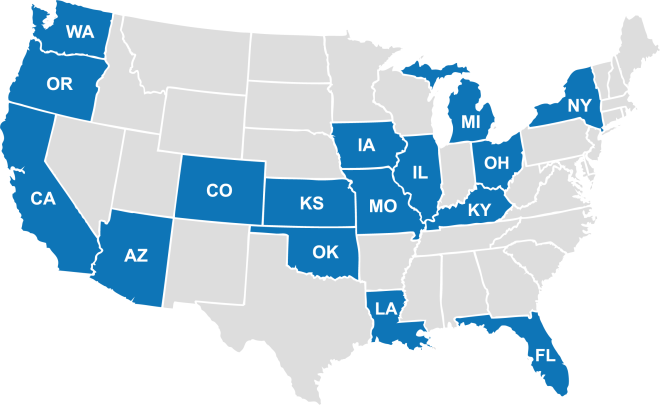
We looked at more than 40 reports from 16 states to see how they handled jobless benefits early in the pandemic.
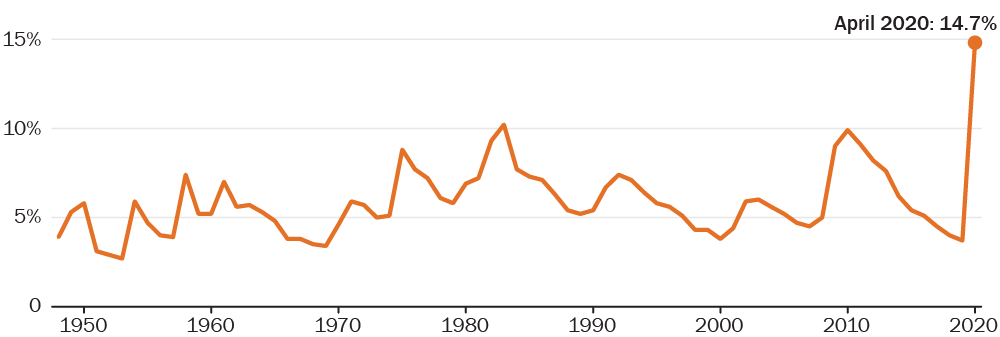
The pandemic caused historic levels of unemployment. By April 2020, the unemployment rate hit 15% - the highest rate since data collection began in 1948.
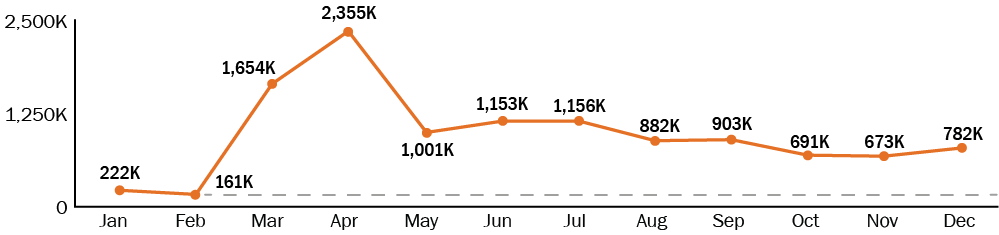
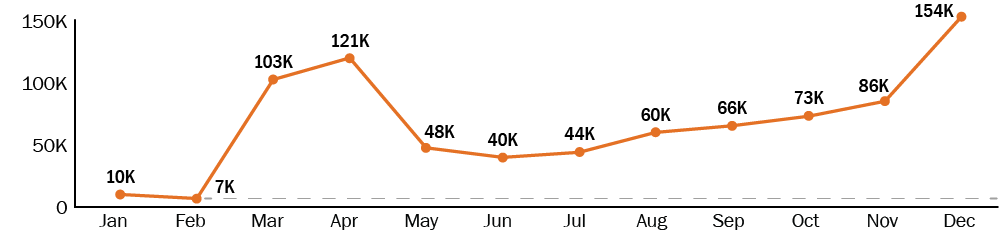
The federal government responded by making $716 billion worth of unemployment benefits available to states. This caused a surge in applications for unemployment benefits.

Kansas received 12.5 million phone calls to its State Workforce Agency customer service line in April 2020.

Oklahoma paid out ten times the amount it does in a typical year.

Washington received more than 180,000 claims in one week in March, 2020. Claims typically peaked at 10,000 per week.
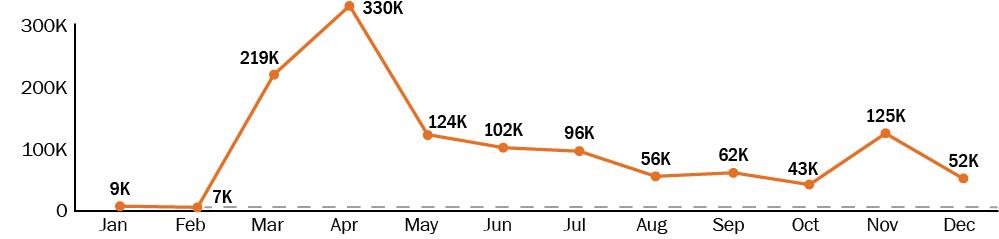
CALIFORNIA
960%
INCREASE
BETWEEN JANUARY
AND APRIL 2020
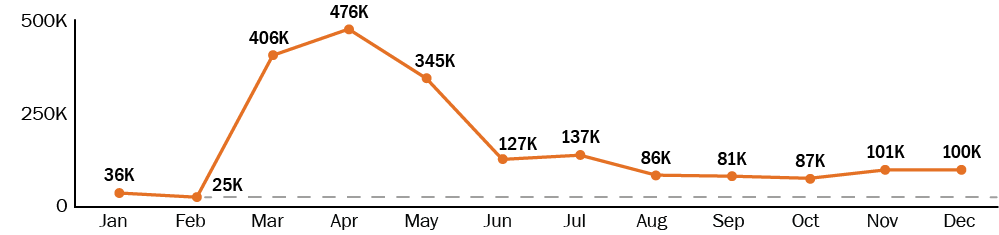
KANSAS
1,092%
INCREASE
BETWEEN JANUARY
AND APRIL 2020
LOUISIANA
3,536%
INCREASE
BETWEEN JANUARY
AND APRIL 2020
OHIO
1,317%
INCREASE
BETWEEN JANUARY
AND APRIL 2020
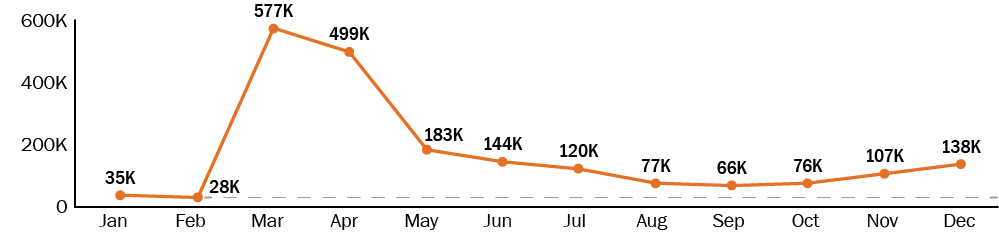
WASHINGTON
1,227%
INCREASE
BETWEEN JANUARY
AND APRIL 2020
The surge overwhelmed State Workforce Agencies that processed the applications.
It took Ohio more than 70 days to process nearly half of its first payments – far longer than the federal government’s goal for states to issue payments within 14 days. The state eventually hired temporary staff to help speed up processing applications.

A new federal unemployment insurance program let applicants self-certify eligibility for benefits – no proof of income or identity needed.
The CARES Act created the Pandemic Unemployment Assistance program to provide unemployment benefits to workers not typically eligible to receive benefits, such as self-employed workers and gig workers. For these types of workers, there is no third party or employer that can verify employment status.
Without the ability to verify eligibility, fraud was rampant. And the schemes varied.

Arizona paid $1.6 billion in benefits to individuals that applied using a stolen identity.
California estimated it sent $800 million in benefits to 45,000 prisoners.

A single social security number was used in 29 states to get more than $220,000 in unemployment benefits.